


A MULTIFAMILY INVESTMENT OPPORTUNITY
● Frederick, MA ●
DISCLOSURE
The following information is an investment summary provided to prospective investors and others. This information is not an offering to sell a security or a solicitation to sell a security. At the request of a recipient, the Company will provide a private placement memorandum, subscription agreement and the Limited Liability Company Operating Agreement. The Managing Member in no way guarantees the projections contained herein. Real estate values, income, expenses and development costs are all affected by a multitude of forces outside the Managing Member’s control. This investment is illiquid and only those persons that are able and willing to risk their entire investment should participate. Please consult your attorney, CPA and/or professional financial advisor regarding the suitability of an investment by you.
This information is confidential and may not be reproduced or redistributed. The information presented herein has been prepared for informational purposes only and is not an offer to buy or sell, or a solicitation of an offer to buy or sell any security or fund interest or any financial instrument and is not to be considered investment advice. This presentation is for institutional use only and is not to be distributed to any party other than its intended recipient.
The following materials present information regarding a proposed creation of a special purpose vehicle (the "Issuer") which would offer securities (the “Securities”) to finance its acquisition of a portfolio of financial assets to be selected and managed by the portfolio manager referred to herein (the "Manager"). These materials have been prepared to provide preliminary information about the Issuer and the transactions described herein to a limited number of potential underwriters of the Securities for the sole purpose of assisting them to determine whether they have an interest in underwriting the Securities.
The views and opinions expressed in this presentation are those of Honey Pot Investments, LLC and are subject to change based on market and other conditions. Although the information presented herein has been obtained from and is based upon sources Honey Pot Investments believe to be reliable, no representation or warranty, expressed or implied, is made as to the accuracy or completeness of that information. No assurance can be given that the investment objectives described herein will be achieved. Reliance upon information in this material is at the sole discretion of the reader.
This data is for illustrative purposes only. Past performance of indices of asset classes does not represent actual returns or volatility of actual accounts or investment managers and should not be viewed as indicative of future results. The investments discussed may fluctuate in price or value. Investors may get back less than they invested.
Forward-looking information contained in these materials is subject to certain inherent limitations. Such information is information that is not purely historical in nature and may include, among other things, expected structural features, anticipated ratings, proposed or target portfolio composition, proposed diversification or sector investment, specific investment strategies and forecasts of future market or economic conditions. The forward-looking information contained herein is based upon certain assumptions, which are unlikely to be consistent with, and may differ materially from, actual events and conditions. In addition, not all relevant events or conditions may have been considered in developing such assumptions. Accordingly, actual results will vary, and the variations may be material. Prospective investors should understand such assumptions and evaluate whether they are appropriate for their purposes. These materials may also contain historical market data; however, historical market trends are not reliable indicators of future market behavior.
Information in these materials about the Manager, its affiliates and their personnel and affiliates and the historical performance of portfolios it has managed has been supplied by the Manager to provide prospective investors with information as to its general portfolio management experience and may not be viewed as a promise or indicator of the Issuer's future results. Such information and its limitations are discussed further in the sections of these materials in which such information is presented.
Past performance of indices or asset classes does not represent actual returns or volatility of actual accounts or investment managers and should not be viewed as indicative of future results. The comparisons herein of the performances of the market indicators, benchmarks or indices may not be meaningful since the constitution and risks associated with each market indicator, benchmark, or index may be significantly different. Accordingly, no representation or warranty is made to the sufficiency, relevance, important, appropriateness, completeness, or comprehensiveness of the market data, information, or summaries contained herein for any specific purpose.
TABLE OF CONTENTS
(click on the section name below to jump directly to that section)


THE TEAM


EXECUTIVE SUMMARY


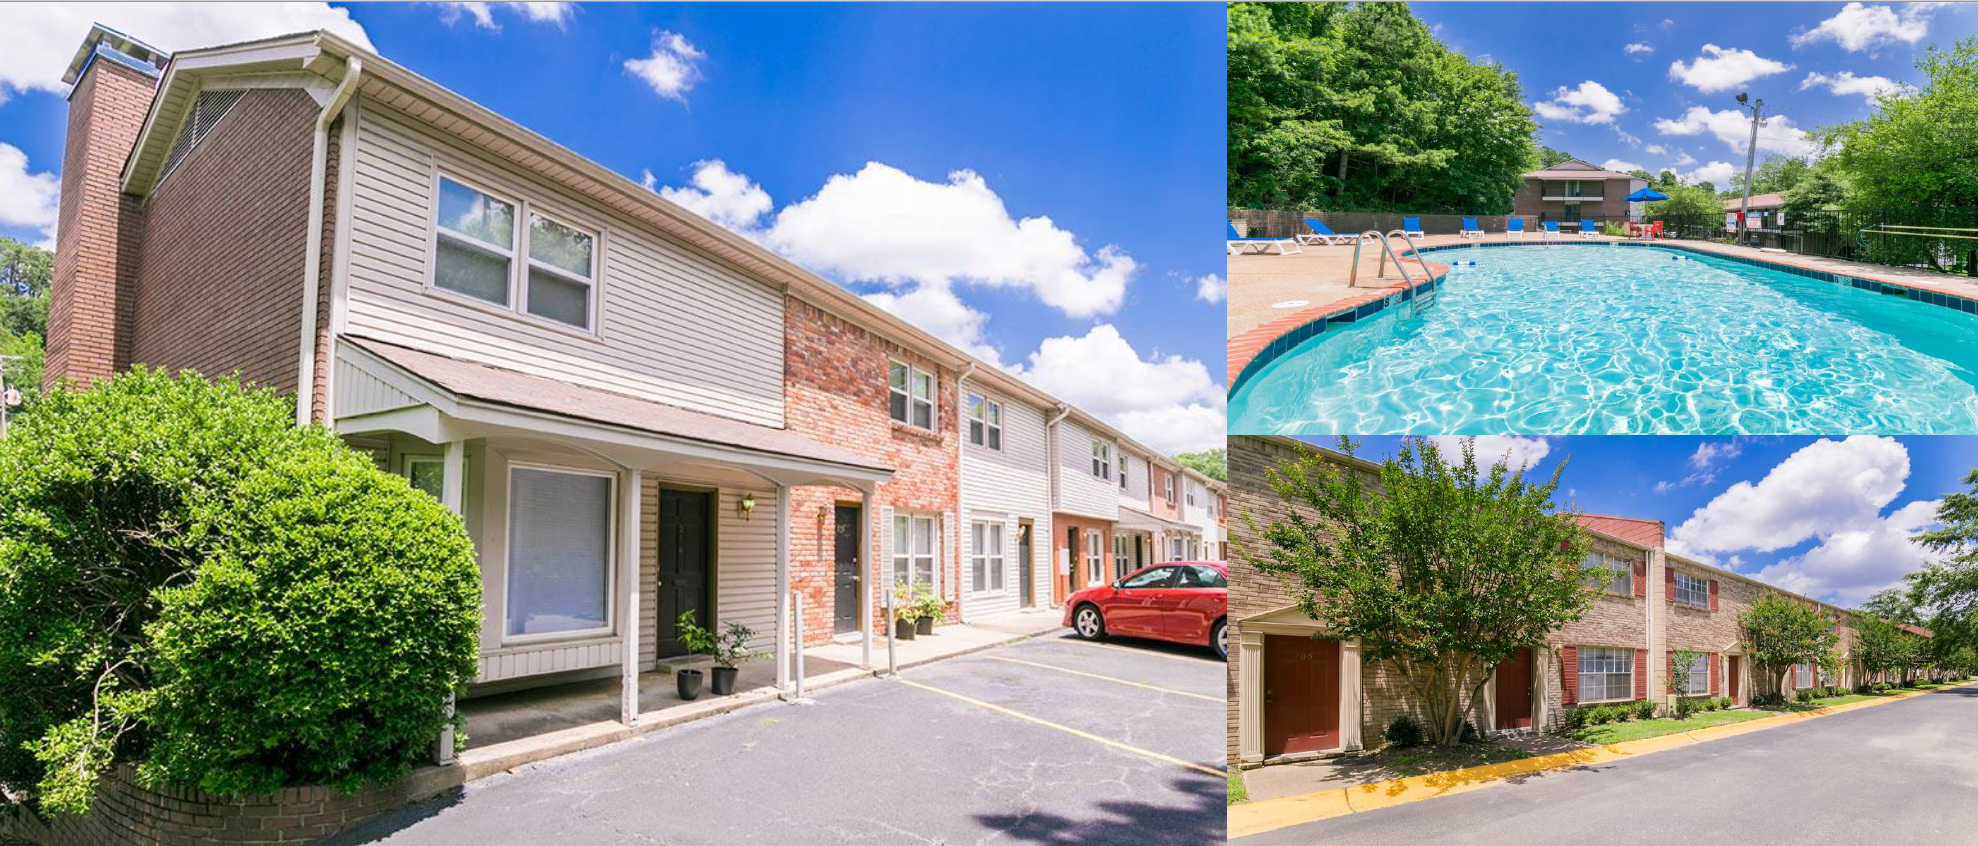
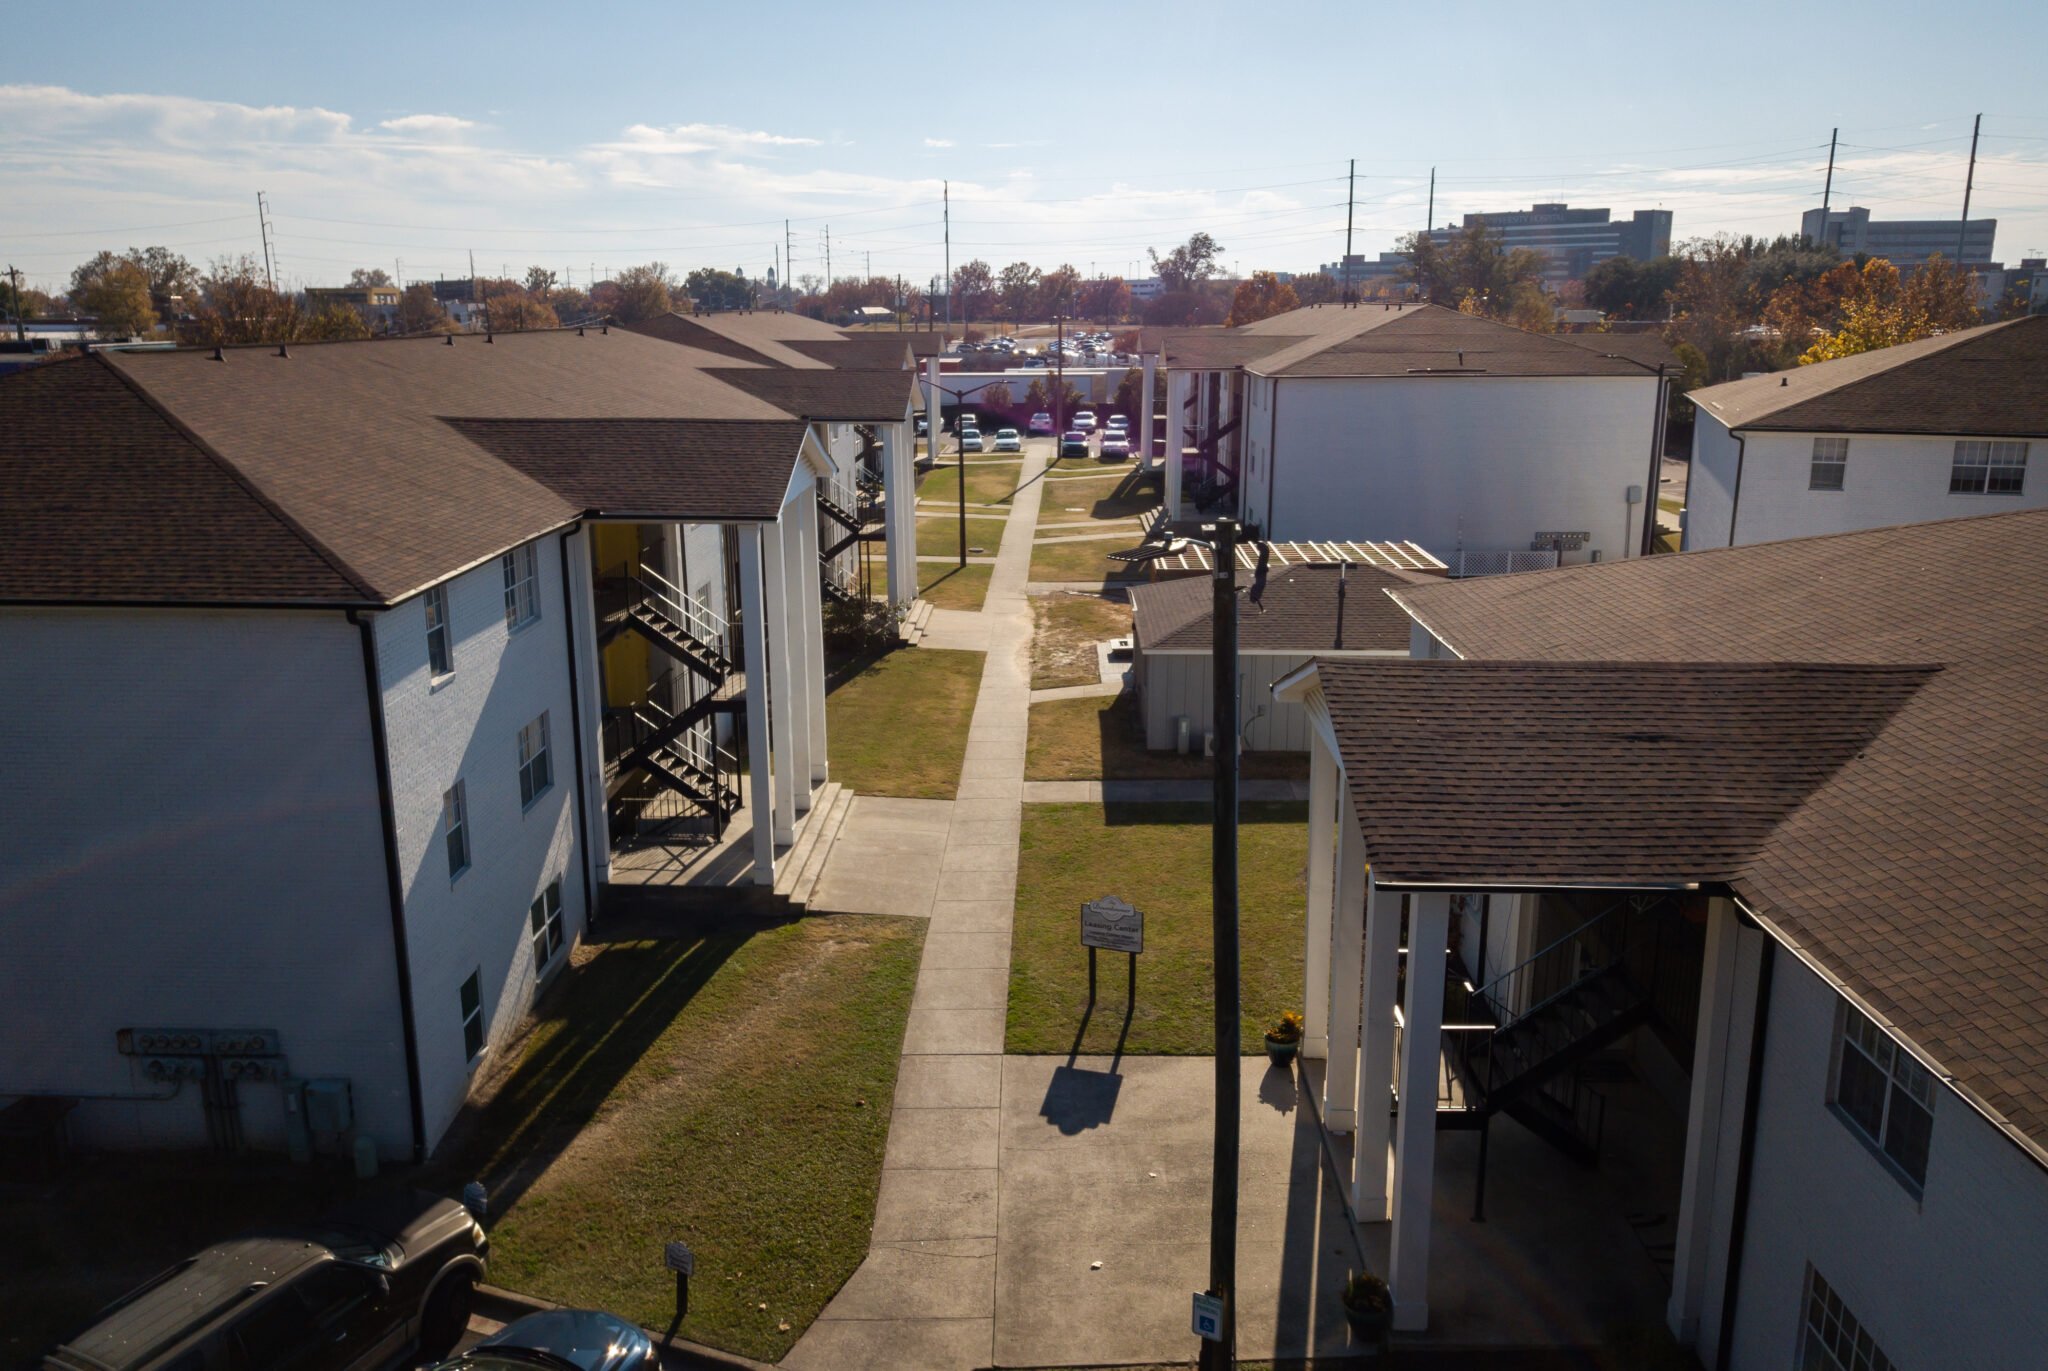
The Sterling Rhino Capital team has identified The Downtowner for acquisition.
We are offering an opportunity to partner with us on a 104-unit, Class B, garden-style apartment community. Built in 1984 on 4.4 acres of land, the complex consists of 100% two bed, two bath units, with 950 Sqft of living area.
The property is situated in the heart of downtown Augusta, within walking distance to the Medical Center, Augusta University, Cyber Innovation center, major retail, restaurants, and the beautiful riverwalk with over 50K downtown employment opportunities.
The Downtowner represents an outstanding opportunity to invest in a proven value-add story with significant upside.
This is a 506(b) offering, available to accredited investors AND 35 sophisticated (approved non-accredited) investors.
KEY INVESTMENT DETAILS
7%
preferred cumulative return starting in month 7 of ownership
18.7%
average annual return (including profits at sale)
8.45%
avg annual cash-on-cash return (not including profits at sale)
1.94x
equity multiple in a 5-Year hold period (see sensitivity analysis)
This is a 506(b) offering. We are accepting investments from accredited investors and 35 non-accredited but sophisticated investors. You need to have a relationship with someone on the sponsorship team in order to have the opportunity to invest.


PROPERTY STATISTICS
104
units
$1.0MM
CapEx Budget
$849
avg. eff rent
98,800
total rentable SF
950
avg SF/unit
$0.89
avg. eff rent/SF
4.4
acres
$125k
purchase price per door
97%
occupancy

KEY MARKET STATISTICS
4.3%
12 mo asking rent growth
2nd
largest MSA in GA
15%
Augusta MSA eff rent growth
in 2020
$1,043
avg comp rent per unit
97%
MSA occupancy rate
71
new development units added in 2020
$0.93
avg rent per SF of comps (CoStar)
$106K
avg comp sale price/door
20%
Augusta MSA population growth 2000-2020
50%
Augusta 5-yr avg rent growth
8,612
population within 1 mi
736,562
Augusta MSA 2020 population
PROPERTY PROFILE

FLOOR PLAN
All Units = 2 BED/2 BATH - Master w/on-suite | Walk-in Closets
950 Sqft


RENTAL/SALE COMPS
In the downtown area there are no comparable Class-B properties. There are either Class-A or Class-C properties within a 1 mile vacinity of The Downtowner. However, this places The Downtowner in a very strong position. It provides a more affordable option than the higher priced Class-A properites but a considerable step up from the lower quality Class-C properties.
Because of this, we do not have any meaningful sale comparables to provide. Below are the downtown rental comparables that we have to work with. Our goal is to remain in the $1,200 - $1,300 rent range over the next 3-5 years, coming in well below our downtown competition. We are anticipating achieving $1,200 rents in less than 3 years.


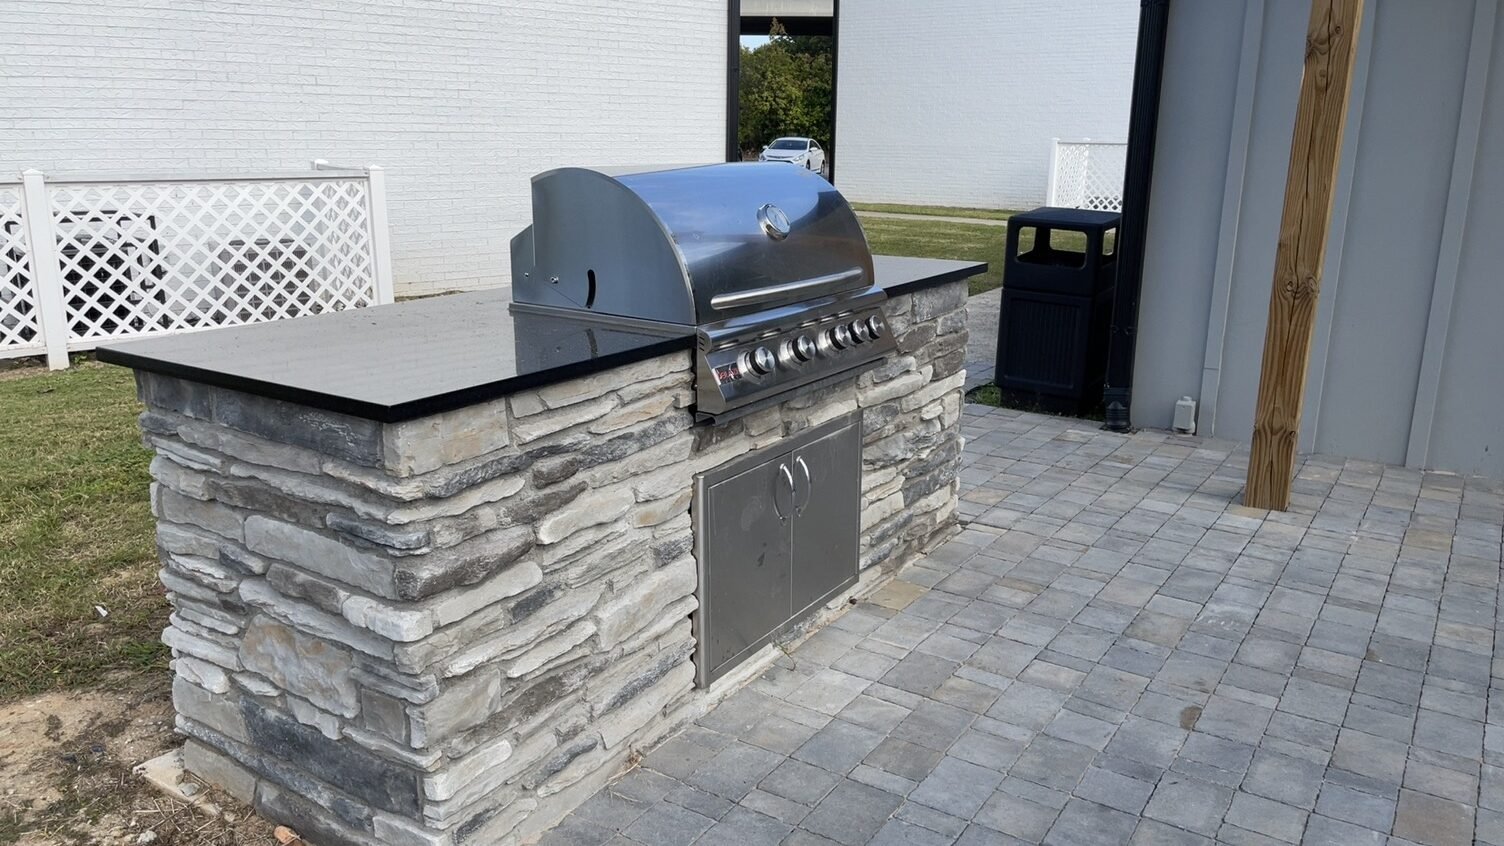
BUSINESS PLAN
Immediately upon taking ownership, we will begin implementation of a $1.0MM renovation plan consisting of interior and exterior upgrades which will lay the groundwork for an improved tenant experience that will warrant receiving the maximum rents that this product and market demands.


NEW LEASING OFFICE (PRE-FABRICATED)

LANDSCAPING BEFORE & AFTER


FINANCIAL ANALYSIS


MARKET ANALYSIS
Augusta By Numbers
MSA Population in 2020
736,562
Total Employment
260,000
Unemployment Rate (Dec 2019)
2.9%
Cost of Living Index
87%
Cost of Business Index
85%
Key Industries
Cyber security, health care, military, science & discovery, manufacturing, higher education
Awards And Accolades
Second largest metropolitan population in the state of Georgia.
Live Career ranked Augusta no. 4 on its 2018 list of “Best Paying Cities for Engineer Jobs” in the U.S.
U.S. News & World Report ranks Augusta’s University Hospital no. 3 “High Performing” of all hospitals in Georgia.
Several of Augusta University’s graduate and professional programs rank among the top in the nation in U.S. News and World Report 2017 “Best Graduate Schools” rankings.
Mid-Market of the Year, Southern Business & Development magazine.
Top Ten Places in the South with Plenty of Talented Labor, Southern Business & Development magazine.
Best Cities to Retire, WalletHub 2016.
Best 100 Places to Live, U.S. News and World Report, 2016.
Children’s Hospital of Georgia No 1 in Nation for Quality & Safety, Univ. Health System Consortium 2015.

Visit the Augusta Economic Development Authority's website for an in-depth look at Augusta's economy.

Positive trending apartment market statistics, a strong job outlook and low inventory contribute to a favorable environment for rent growth
and successful leasing.
** Effective Rent In The Market Grew 15% In 2020 To $949 Per Month In The Beginning Of 2021, Outpacing The National Average Of 0.2%.
** The Average Occupancy Rate In The Submarket Was 97% In December 2020.
** Augusta Offers A Limited New Development Pipeline With Only 71 New Units Added To The Submarket’s Apartment Inventory In 2020.
** Population In The Augusta Has Grown By More Than 20% Since 2000 As Development In The Area Has Surged In Recent Years, Attracting New Residents For Its Relative Affordability And Excellent Access.

Augusta rent growth over the last five years leads among Georgia markets at 50% and forecast growth leads as well at Net % for 2021.

AUGUSTA JOB ANNOUCEMENTS

CYBER INNOVATION CARRIES TORCH FOR SPECIALIZED INDUSTRY GROWTH

Augusta’s expanding economy is anchored by the core sectors of government and health care, specialized industries like energy and education benefiting substantially from the rise of cyber-technology.

NEW CITY PROJECTS
FIFTH ST BRIDGE - $10M PEDESTRIAN BRIDGE PROJECT
Connecting Downtown Augusta with South Carolina - It will bring more foot traffic into the city. Paths for Walking, Biking, Shaded Sitting Areas, Lights,


FREQUENTLY ASKED QUESTIONS
How and when will distributions be made?
We will pay distributions quarterly, in the month following the end of the quarter. Payments will only be made via ACH direct deposit to the bank account that you provide to us upon committing your investment.
When is the first distribution?
The 7% preferred return distribution will not start until month 7 of ownership, paid at the end of the 3rd quarter. This gives management an opportunity to settle in, assess the operations, ensure the property is cash flowing, and pay investors with the operating cash flow.
Is the General Partnership team investing any of their own money?
Yes. The GP team is investing a minimum of $300,000 of their own funds into this deal.
Will you be doing a cost segregation study that includes bonus depreciation?
Yes, we will be hiring Engineered Tax Services to perform a cost segregation study to maximize the depreciation and bonus depreciation (assuming current tax laws remain in place) for the 2022 tax year. The projected tax dollar benefits to be captured looks to be an estimated 60-65% of your total investment amount. For example, if you invested $100,000, you could potentially have $60,000 of passive paper losses on your 2021 K-1 statement. Consult your CPA on how this could affect your taxes.
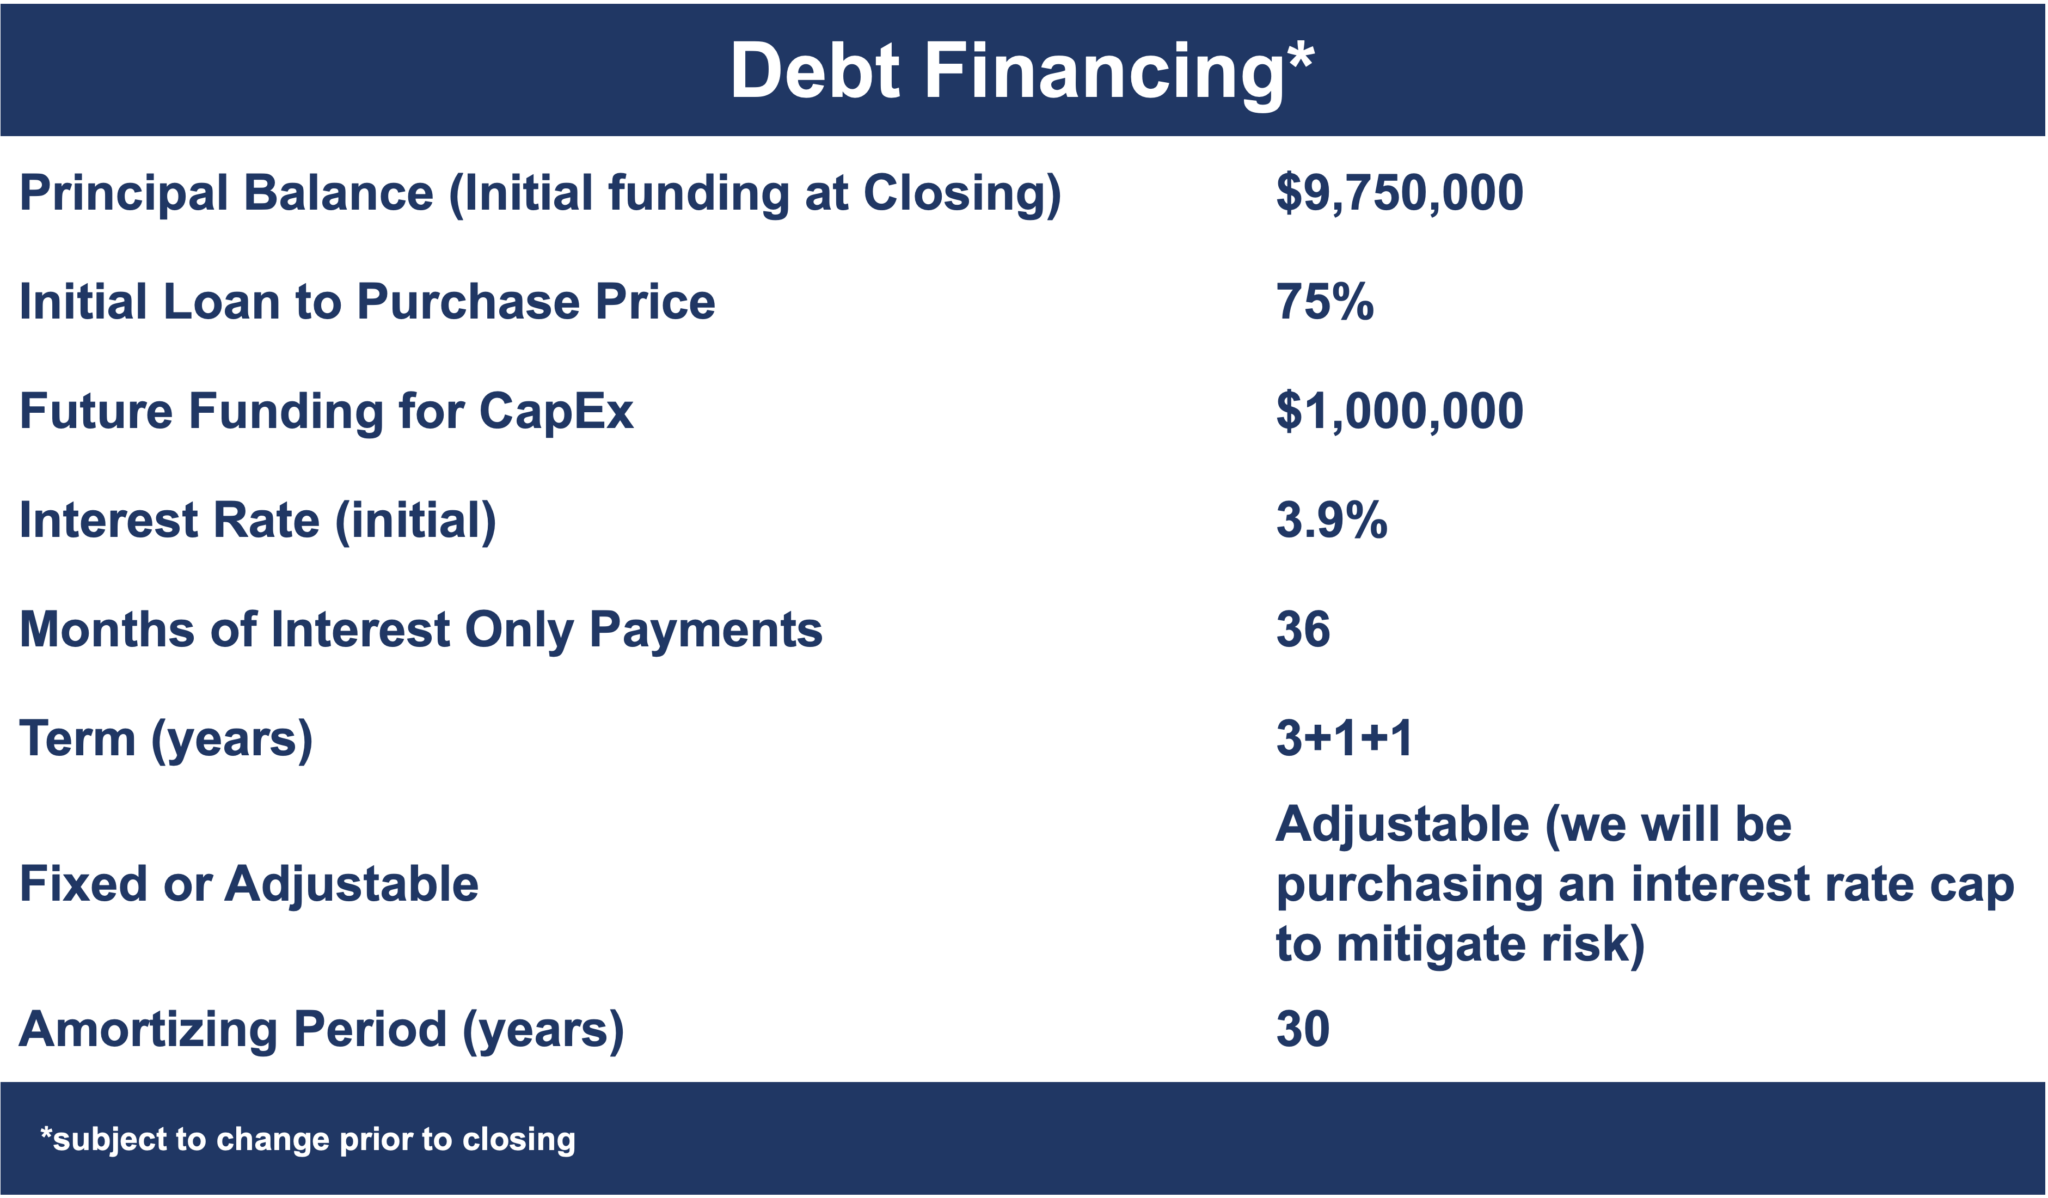
What does a “3+1+1” loan term mean?
This means that our initial loan term is for 3 years, with the option for two, one-year extensions for a total of 5 possible years before needing to refinance or sell. This gives us flexibility to refinance or exit the deal at various points when it makes the most sense. The extensions come with fees that have been included in our underwriting, assuming that we will hold for the full 5-year period.
Why is there a range given on the total projected returns?
We estimate the profits at sale based on a prediction of the market cap rate at that time, in this case, 5 years from now. Rather than guess with a single number, we like to show a wider range of possible cap rates, above and below the current, to capture what we believe to be a more accurate display of the possible returns. Think of it as a best-case and worst-case scenario, although returns could still fall outside of these predictions.
Can I invest less than $50,000?
At this point in time, we are NOT accepting investment amounts less than $50,000.
What is the most amount of money I can invest in this deal?
The maximum investment amount for this deal is $400,000.

IMPORTANT DATES

Property Management

Founded in 2004, Trinity Multifamily offers the highest quality property management service, construction, property rehab, consulting and due diligence for all of their clients. Their property management team combines the experience of ownership, development and management of multifamily apartment communities with their expertise in marketing, leasing, sales and renovation to maximize long term profitability for their owners. They manage many properties in the Southern/Midwestern United States.
With more than 50 years of combined property management experience, the Trinity Multifamily principals have developed, redeveloped, and/or repositioned more than 30,000 multifamily apartments and condominiums.
REAL ESTATE TERMS AND DEFINITIONS
Capitalization Rate (Cap Rate): A rate of return on a real estate investment property based on the expected income that the property will generate. Capitalization rate is used to estimate the investor's potential return on his or her investment. This is done by dividing the income the property will generate (after fixed costs and variable costs) by the total value of the property.
When acquiring income property, the higher the capitalization rate (“Cap Rate”), the better. When selling income property, the lower the Cap Rate the better.
A higher cap rate implies a lower price, a lower cap rate implies a higher price.
Cash Flow: Cash generated from the operations of a company, generally defined as revenues less all operating expenses.
Cash-on-Cash (COC): A rate of return often used in real estate transactions. The calculation determines the cash income on the cash invested.
Calculation: Annual Dollar Income Return / Total Equity Invested = Cash-on-Cash.
Debt Service Coverage Ratio (DSCR): It is the multiples of cash flow available to meet annual interest and principal payments on debt. This ratio should ideally be over 1.
Return on Equity (ROE): The amount of net income returned as a percentage of shareholders equity.
Average Annual Return (AAR) excluding disposition: The average return per year during the investment hold.
Investor Average Annual Return, including disposition: The average return per year including profits from disposition. This calculation does not include the return of invested capital.
Internal Rate of Return (IRR): The rate of return that would make the present value of future cash flows plus the final market value of an investment opportunity equal the current market price of the investment or opportunity. The higher a project's internal rate of return, the more desirable it is to undertake the project.

Yes, I would like to make a soft commitment to this investment opportunity!
Note: A soft commitment notifies us of your interest but does not guarantee your spot in the deal. Your spot is only guaranteed once your legal documents are signed and your funds have been wired.

